Building a Delivery Intelligence Dashboard in HEX
When we restructured a Cannabis Delivery Service Client’s delivery zones, the team had a handful of important questions that we couldn’t easily answer:
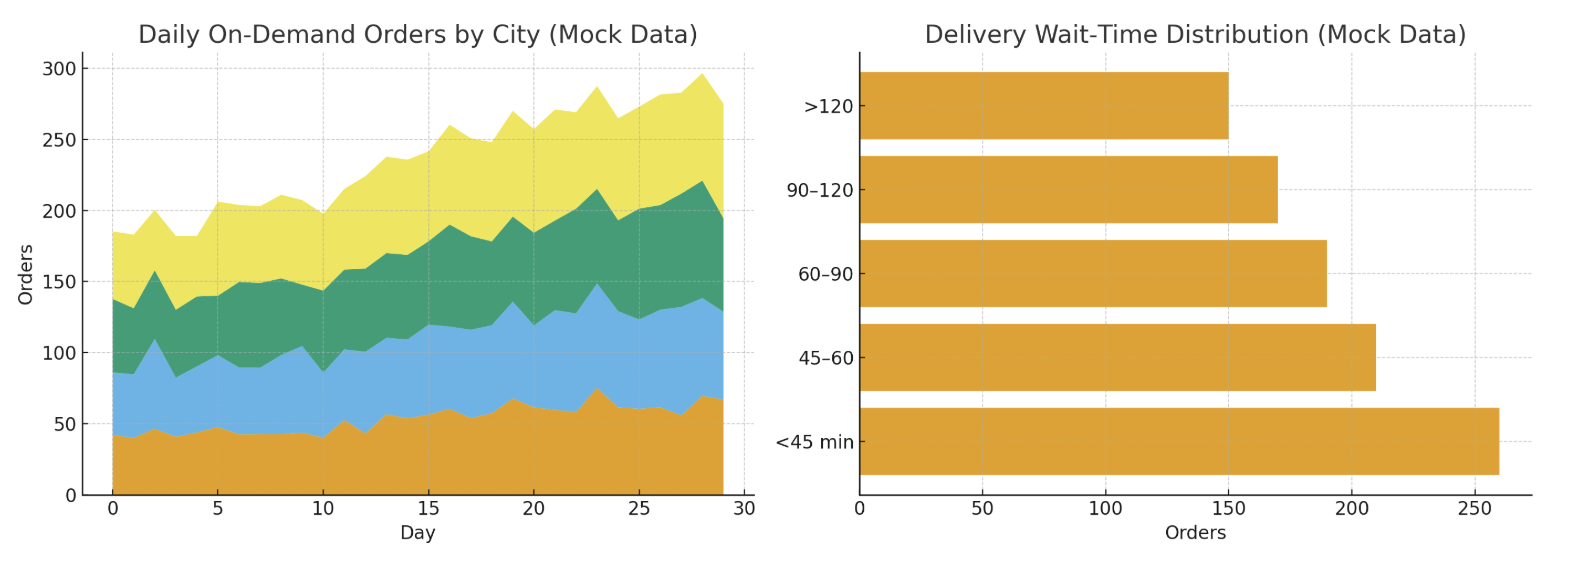
How did orders shift by city after the restructure?
Which markets gained or lost traction?
What were our true on-demand delivery times?
And which channels were actually responsible for completed orders?
We had plenty of raw data—but no centralized BI setup and no analyst to make sense of it.
To close that gap, I built a delivery intelligence dashboard in HEX, giving the company a clearer picture of what was happening across the business. What would normally require multiple data scientists and an expensive Looker or Tableau setup was done in minutes with a low-cost HEX subscription!
1. Turning Raw Data Into a Usable Model
I started by uploading our order exports into HEX—Blaze logs, internal CSVs, and attribution fields. The goal was to move from scattered spreadsheets to a structured dataset that could answer time-based questions across cities and order types.
Using HEX’s Python + SQL cells, I cleaned and standardized the data, created city-level time series, segmented on-demand vs. scheduled orders, and tagged pre/post restructure periods. That gave us a flexible foundation for real analysis.
2. Understanding City Trends After the Restructure
With the data modeled, I built dashboards showing orders by city over time. This gave leadership an immediate read on the restructure:
Which cities were growing
Which were declining
Where volume was shifting week to week
Where we needed to adjust staffing, driver coverage, or marketing support
Instead of relying on gut feel, we could finally see the impact in one place.
3. Measuring Real Delivery Speed
The next question was operational:
How fast are we actually delivering on-demand orders?
By charting order times, assignment times, and delivery completions, we built a clear wait-time distribution. This showed:
The percentage of orders delivered under 45 minutes
Where delays were happening
Differences by city and time of day
It became a benchmark for the ops and dispatch teams and helped identify where routing or staffing changes were needed.
4. Knowing Which Channels Drive Real Orders
With attribution data layered in, we created a view of completed orders by channel—Weedmaps, direct traffic, SMS/email, search, and paid tests. This shifted how we evaluated marketing performance and helped us invest more confidently in the channels driving actual revenue, not just impressions or clicks.
5. Sharing the Dashboard Across the Company
Once the dashboard was stable, I shared it with managers across marketing, operations, customer support, and leadership. It quickly became:
A single source of truth
A transparent operational benchmark
A weekly reporting tool
A shared foundation for strategic decisions
HEX didn’t just answer one question—it gave the entire team visibility into the business.
Outcome
In a matter of days, we went from scattered CSVs to a functional intelligence dashboard that clarified market trends, delivery performance, and channel ROI. It allowed the team to make decisions faster and with more confidence—without needing a full analytics hire or heavy BI infrastructure.
I greatly recommend HEX for any small to medium-sized business that lacks a full-blown data team!